

Current oil prices have seen historic lows in the last few months falling to $ 26 per barrel in February 2016. Since then oil prices have recovered and swung between the mid forties and low fifties.
There are a number of reasons for why oil is relatively cheap; from economic growth worries to an oversupply. The United States, for instance, has almost doubled production of oil, also due to an increase in fracking activity. With an oversupply, oil prices logically had to adjust and drop to new lows. However, there appears – this cannot only be observed in the rise of the oil price – a shift to lower levels of output. Not only because various drilling projects had been canceled in the aftermath of low oil prices making drilling and production of crude cost inefficient, but also rebel attacks, for instance, in Nigeria have curtailed oil supplies, and more importantly demand appears to be picking up again.
Political and societal aspects aside, what exactly is the relationship between oil reserves, production, consumption, and its price between 1980 and 2016. Once adjusted for inflation, how much more expensive is oil really and would it have been a good investment over the years?
If you cannot be bothered to read the article, just jump to the conclusion of which out of the three – oil reserves, production, consumption – have moved most in sync with the price of oil per barrel.
How much oil was there in relation to the oil price between 1980 and 2016 (adjusted for inflation)?
Let’s look at a number of things for the years 1980 to 2016:
- The Oil Reserves for a given year
- The Oil Production for a given year
- The Oil Consumption for a given year
The data is an accumulation of oil related news and data from sources including OPEC, U.S. Energy and Information Administration, Oil & Gas Journal, International Energy Agency, and the Federal Reserve Bank of St. Louis.
Currently oil appears to be relatively cheap when comparing the price to only a few years ago when one barrel of oil briefly cost over $ 100. But since the oil price has collapsed, or at least it appears as such.
The average oil price between 1980 and 2016 was $ 54.50. This is still more than the $ 47.84 for a barrel of Brent Crude (ICE) as of writing this blog post. In other words, oil is still over 12% cheaper than the average price for a barrel since 1980. So oil is cheap, however, not as cheap as you might think when looking at the historical data.
If you are an avid reader, you have probably noticed that I do believe that companies such as Total still have upward share price potential, but this is because they offer more than just oil. But what about oil per se? Given that oil is cheaper today than it’s been, on average, in the last 26 years, what can we learn from the past that might predict the direction of oil in the future? Are there any relationships between the reserves, production, and consumption of oil that have moved its price?
Oil reserves and their influence on the price of oil
I don’t know about your school days, but I remember my economics teacher back in the 1980s telling us that we would soon run out of oil – that was twenty-five years ago. A quick glimpse at the above chart paints a very different picture: oil reserves are constantly growing, from 906 billion barrels of global crude oil reserves in 1980 to a predicted 2 trillion barrels of crude in 2016. I guess my teacher was a bit off back in the day.
Global oil reserves between 1980 and 2016
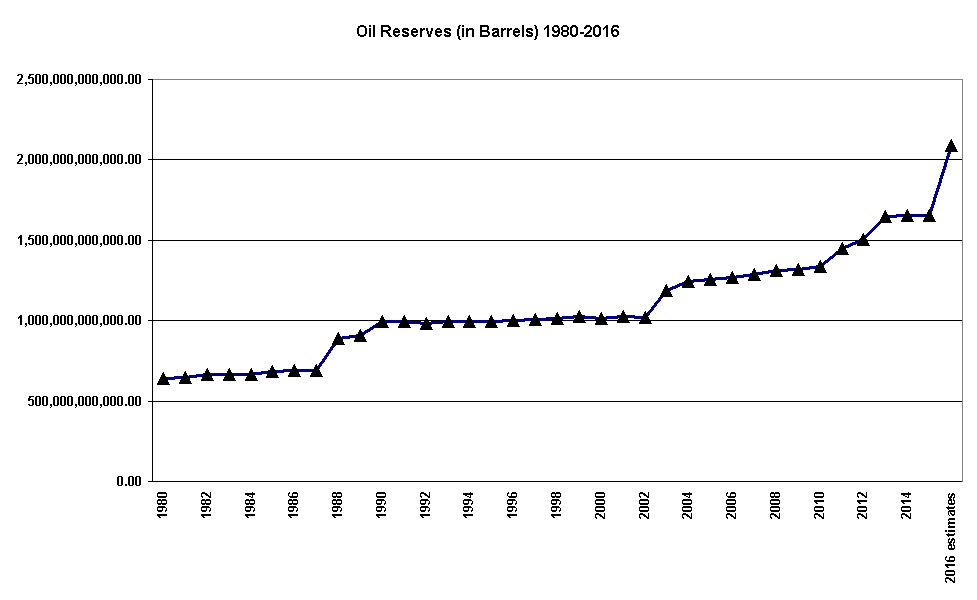
So are oil reserves and price development related? In fact, less than half the time (47%) when the world saw oil reserves diminish or grow did the price of crude react in a similar pattern. Since 2010, however, four out of the seven years the oil price move as expected with the level of global oil reserves.
Development of oil reserves and inflation adjusted price per barrel of crude between 1980 and 2016
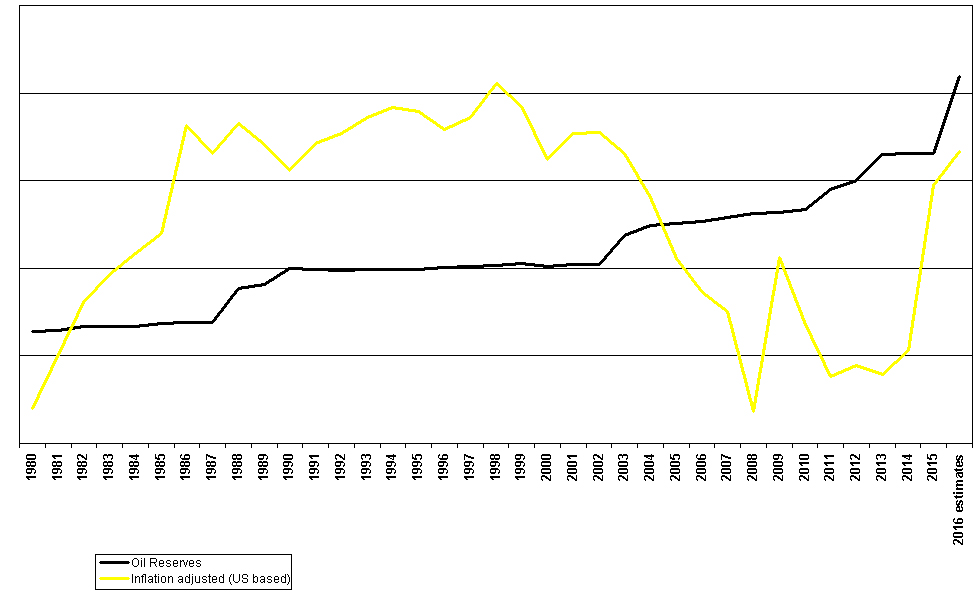
Oil reserves and inflation adjusted price per barrel of crude
| Year | Oil Reserves | Inflation adjusted (US based) | Do Price and Reserves move in the same direction? |
|---|---|---|---|
| 1980 | 639,933,494,913.21 | 110.44 | |
| 1981 | 646,129,710,743.60 | 95.59 | Opposite direction |
| 1982 | 667,399,761,740.53 | 81.33 | Opposite direction |
| 1983 | 665,632,416,686.92 | 73.81 | Same direction |
| 1984 | 665,632,416,686.92 | 67.96 | Same direction |
| 1985 | 685,813,404,543.76 | 62.49 | Opposite direction |
| 1986 | 692,607,062,028.49 | 32.92 | Opposite direction |
| 1987 | 688,928,690,690.43 | 40.58 | Opposite direction |
| 1988 | 887,534,409,389.42 | 32.43 | Opposite direction |
| 1989 | 906,017,761,611.67 | 38.15 | Same direction |
| 1990 | 996,512,617,416.85 | 45.07 | Same direction |
| 1991 | 992,745,477,993.86 | 37.94 | Same direction |
| 1992 | 985,428,456,615.31 | 35.2 | Same direction |
| 1993 | 992,089,780,952.37 | 30.69 | Opposite direction |
| 1994 | 994,320,693,160.58 | 27.85 | Opposite direction |
| 1995 | 995,245,829,688.85 | 29.05 | Same direction |
| 1996 | 1,003,368,146,461.96 | 33.88 | Same direction |
| 1997 | 1,010,515,434,204.63 | 30.82 | Opposite direction |
| 1998 | 1,016,074,690,983.43 | 21.25 | Opposite direction |
| 1999 | 1,028,752,689,476.39 | 27.64 | Same direction |
| 2000 | 1,012,772,230,245.96 | 42.3 | Opposite direction |
| 2001 | 1,024,132,414,365.86 | 35.11 | Opposite direction |
| 2002 | 1,019,954,478,268.02 | 34.88 | Same direction |
| 2003 | 1,185,111,837,366.92 | 40.61 | Same direction |
| 2004 | 1,242,025,608,690.66 | 52.71 | Same direction |
| 2005 | 1,254,227,673,605.06 | 69.43 | Same direction |
| 2006 | 1,269,935,547,962.17 | 78.71 | Same direction |
| 2007 | 1,288,662,425,938.03 | 83.76 | Same direction |
| 2008 | 1,311,043,103,456.12 | 111.12 | Same direction |
| 2009 | 1,319,011,313,716.50 | 69.08 | Opposite direction |
| 2010 | 1,334,743,406,577.71 | 87.48 | Same direction |
| 2011 | 1,451,760,996,030.44 | 101.51 | Same direction |
| 2012 | 1,503,956,832,933.50 | 98.5 | Opposite direction |
| 2013 | 1,647,000,000,000.00 | 100.99 | Same direction |
| 2014 | 1,654,000,000,000.00 | 94.51 | Opposite direction |
| 2015 | 1,656,000,000,000.00 | 49.41 | Opposite direction |
| 2016 estimates | 2,092,000,000,000.00 | 40.12 | Opposite direction |
So do the oil reserves appear to be a good predictor? Well, less than half the time they are. What about oil production and consumption?
Oil production and its influence on the price of oil
So are oil production and price development related? In fact, 61% of the time between 1980 and 2016, prices rose with higher levels of production. The more oil was produced, the higher the price of oil, or more likely the inverse is true: the higher the price, the more oil refineries produced to benefit from the higher oil price. Just to be absolutely clear, I am not claiming any type of causality, this is way beyond this blog post and would call for a proper statistical analysis. Since 2010, however, five out of the seven years the oil price fell when production grew. However, in the light of the recent OPEC meetings and other issues around oil, including fracking and Iran joining the global oil markets after years of sanctions, this pattern actually makes absolute sense. There appears to be some sort of threshold when this relationship between oil production and price becomes inverted.
Development of oil production and inflation adjusted price per barrel of crude between 1980 and 2016

Oil production and inflation adjusted price per barrel of crude
| Year | Oil Reserves | Inflation adjusted (US based) | Do Price and Reserves move in the same direction? |
|---|---|---|---|
| 1980 | 59,420,560,000 | 110.44 | |
| 1981 | 55,904,870,000 | 95.59 | Same direction |
| 1982 | 53,312,600,000 | 81.33 | Same direction |
| 1983 | 53,130,850,000 | 73.81 | Same direction |
| 1984 | 54,379,940,000 | 67.96 | Opposite direction |
| 1985 | 53,843,260,000 | 62.49 | Same direction |
| 1986 | 56,202,610,000 | 32.92 | Opposite direction |
| 1987 | 56,536,070,000 | 40.58 | Same direction |
| 1988 | 58,593,860,000 | 32.43 | Opposite direction |
| 1989 | 59,694,830,000 | 38.15 | Same direction |
| 1990 | 60,404,450,000 | 45.07 | Same direction |
| 1991 | 60,112,960,000 | 37.94 | Same direction |
| 1992 | 60,093,480,000 | 35.2 | Same direction |
| 1993 | 60,157,950,000 | 30.69 | Opposite direction |
| 1994 | 58,805,190,000 | 27.85 | Same direction |
| 1995 | 59,949,600,000 | 29.05 | Same direction |
| 1996 | 61,282,650,000 | 33.88 | Same direction |
| 1997 | 63,317,670,000 | 30.82 | Opposite direction |
| 1998 | 64,468,210,000 | 21.25 | Opposite direction |
| 1999 | 63,322,390,000 | 27.64 | Opposite direction |
| 2000 | 66,268,410,000 | 42.3 | Same direction |
| 2001 | 65,865,380,000 | 35.11 | Same direction |
| 2002 | 64,973,320,000 | 34.88 | Same direction |
| 2003 | 67,327,290,000 | 40.61 | Same direction |
| 2004 | 70,706,050,000 | 52.71 | Same direction |
| 2005 | 72,176,090,000 | 69.43 | Same direction |
| 2006 | 71,945,590,000 | 78.71 | Opposite direction |
| 2007 | 71,611,840,000 | 83.76 | Opposite direction |
| 2008 | 72,581,540,000 | 111.12 | Same direction |
| 2009 | 71,317,640,000 | 69.08 | Same direction |
| 2010 | 73,216,290,000 | 87.48 | Same direction |
| 2011 | 73,485,090,000 | 101.51 | Same direction |
| 2012 | 75,063,800,000 | 98.5 | Opposite direction |
| 2013 | 74,941,000,000 | 100.99 | Opposite direction |
| 2014 | 76,267,000,000 | 94.51 | Opposite direction |
| 2015 | 77,833,000,000 | 49.41 | Opposite direction |
| 2016 estimates | 84,837,970,000 | 40.12 | Opposite direction |
So does oil production appear to be a good predictor? Well, 61% of the time it is. What about oil consumption?
Oil consumption and its influence on the price of oil
So are oil consumption and price development related? In fact, 56% of the time between 1980 and 2016, they moved in the same direction. The more oil was consumed, the higher, the price of oil. Since 2010, however, four out of the seven years oil became more expensive with growing demand.
Development of oil consumption and inflation adjusted price per barrel of crude between 1980 and 2016
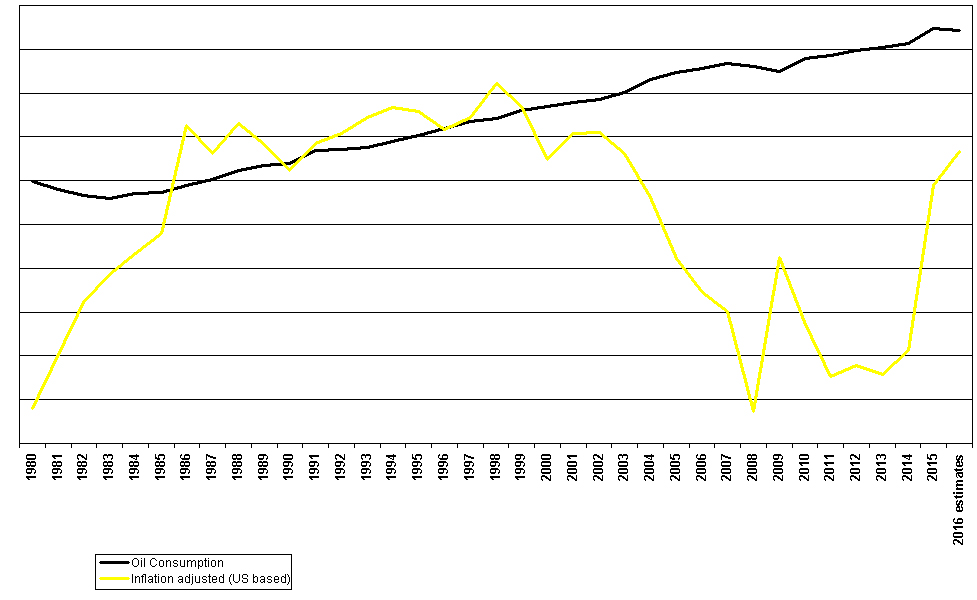
Oil consumption and inflation adjusted price per barrel of crude
| Year | Oil Consumption | Inflation adjusted (US based) | Do Price and Consumption move in the same direction? |
|---|---|---|---|
| 1980 | 59,928,840,000 | 110.44 | |
| 1981 | 58,013,310,000 | 95.59 | Same direction |
| 1982 | 56,722,960,000 | 81.33 | Same direction |
| 1983 | 56,002,250,000 | 73.81 | Same direction |
| 1984 | 57,064,080,000 | 67.96 | Opposite direction |
| 1985 | 57,382,490,000 | 62.49 | Opposite direction |
| 1986 | 58,996,110,000 | 32.92 | Opposite direction |
| 1987 | 60,385,750,000 | 40.58 | Same direction |
| 1988 | 62,269,800,000 | 32.43 | Opposite direction |
| 1989 | 63,497,390,000 | 38.15 | Same direction |
| 1990 | 63,875,120,000 | 45.07 | Same direction |
| 1991 | 66,970,880,000 | 37.94 | Opposite direction |
| 1992 | 67,136,270,000 | 35.2 | Opposite direction |
| 1993 | 67,587,540,000 | 30.69 | Opposite direction |
| 1994 | 68,927,090,000 | 27.85 | Opposite direction |
| 1995 | 70,256,200,000 | 29.05 | Same direction |
| 1996 | 71,878,410,000 | 33.88 | Same direction |
| 1997 | 73,591,530,000 | 30.82 | Opposite direction |
| 1998 | 74,266,630,000 | 21.25 | Opposite direction |
| 1999 | 75,967,470,000 | 27.64 | Same direction |
| 2000 | 76,959,100,000 | 42.3 | Same direction |
| 2001 | 77,756,450,000 | 35.11 | Opposite direction |
| 2002 | 78,526,760,000 | 34.88 | Opposite direction |
| 2003 | 80,173,850,000 | 40.61 | Same direction |
| 2004 | 83,176,980,000 | 52.71 | Same direction |
| 2005 | 84,668,040,000 | 69.43 | Same direction |
| 2006 | 85,586,390,000 | 78.71 | Same direction |
| 2007 | 86,700,090,000 | 83.76 | Same direction |
| 2008 | 86,027,860,000 | 111.12 | Opposite direction |
| 2009 | 84,953,360,000 | 69.08 | Same direction |
| 2010 | 87,839,100,000 | 87.48 | Same direction |
| 2011 | 88,657,700,000 | 101.51 | Same direction |
| 2012 | 89,668,910,000 | 98.5 | Opposite direction |
| 2013 | 90,354,270,000 | 100.99 | Same direction |
| 2014 | 91,253,207,130 | 94.51 | Opposite direction |
| 2015 | 94,740,000,000 | 49.41 | Opposite direction |
| 2016 estimates | 94,200,000,000 | 40.12 | Same direction |
So does oil consumption appear to be a good predictor? Well, 56% of the time it is. Initially, the blog post set out to determine how oil reserves and the price have developed between 1980 and 2016, but it was interesting to see that the price of oil has moved most in line with oil production. Per se this is not sufficient to make an investment call, however, it is an interesting insight that can help us make a decision of whether or not the price of oil is too high, about right, or a great time to invest.
Have fun investing and growing your portfolio and galleon of wealth.
If you want to read in more depth, here are the sources for this blog post:
- https://www.iea.org/oilmarketreport/omrpublic/currentreport/#Demand
- http://fortune.com/2016/07/05/oil-reserves-us/
- http://www.eia.gov/cfapps/ipdbproject/iedindex3.cfm?tid=5&pid=57&aid=1&cid=regions&syid=1980&eyid=2014&unit=TBPD
- http://www.ogj.com/articles/print/volume-113/issue-12/special-report-worldwide-report/reserves-grow-modestly-as-crude-oil-production-climbs.html
- http://www.opec.org/opec_web/en/publications/338.htm
- http://www.indexmundi.com/energy.aspx?product=oil&graph=production
- http://participatoryscience.org/
- https://www.quandl.com/data/CHRIS/ICE_B1-Brent-Crude-Futures-Continuous-Contract-1-B1-Front-Month
- https://fred.stlouisfed.org/series/POILWTIUSDA
- Log in to post comments