
I admit it has been quite some time since my last post. Life has gotten in the way. But I will try and again post more regularly going forward. I hope you have used the time productively as well and build your wealth and lived life to the fullest.
To start the new chapter, let’s look at what the pandemic has done to our finances.
A lot has happened in the last two years, looking back, however, it is shocking how quickly time passes. It has been five years since we last looked at the average wealth per person in countries such as the USA, UK, Luxembourg, Germany, France, and many others. It has been a mind-blowing seven years that we first looked at the median net wealth per person per country.
It is interesting reading through the last article and see how little has changed. When I see little has changed, it doesn’t refer to the wealth per se, but to the events that unfolded in the respective year that we looked at the average net wealth. Take, for instance, the stock market. For years we have heard so-called experts proclaim that the end of the bull run is near. Well, I guess they can tap themselves on the shoulder. The stock market did tank in March 2020. However, that bear market was short-lived as we all know.
Even if you didn’t ride the bull market that began with the recovery last year, maybe you made your fortune in cryptocurrency, trading or earning some bitcoins or altcoins. If you wonder where you stand in comparison to others, check out the below wealth pyramid. It shows the distribution of wealth among all adults across the globe.
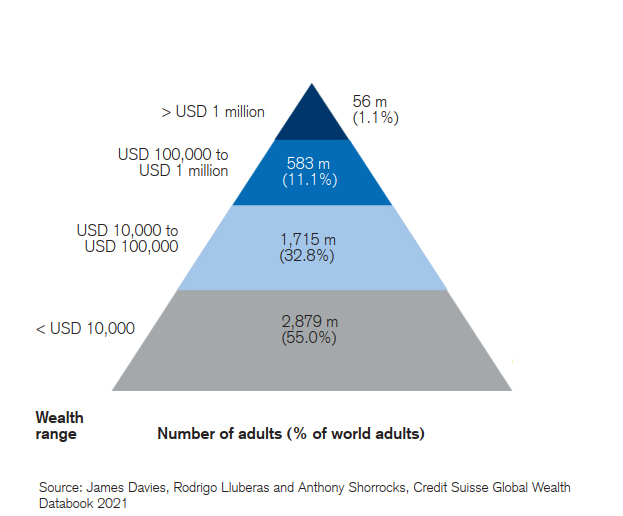
Thus, have people become richer in the last five years? According to Credit Suisse very much so. The Global Wealth Report 2021 points out that the average wealth per adult has increased 6%. Thus, if you are one of the lucky ones, you should be looking at $ 79,952 in net wealth - a historic high.
Granted, this is worldwide, including some of the richest countries in the world and some of the countries, particularly in Asia, that have produced a huge number of millionaires and billionaires in recent years. A quick trip through history proves how impressive that number is, however. In 2000, the average net wealth per adult was $ 31,378, or a bit more than half of what it is today. Adjusting for inflation, the net worth per adult across the globe was $ 49,984 – a huge difference to the wealth the average adult can enjoy today. As always, averages are averages and don’t account for any extremes. It is still indicative how important investing in stocks and properties are for building wealth. Something that we can observe in the democratization of investing through the likes of Robinhood.
Regardless, why are people becoming richer during a pandemic, you may wonder? It is noteworthy that during the pandemic-induced crash in March 2020, the wealth per adult declined by 4.7% according to the Credit Suisse report. To be frank, I think that is an underestimate. Anyone who was invested in the stock market at the time saw their portfolios go down 30, 40, even 50%. This, however, was countered by another substantial increase in property prices. Just another proof for how important diversification is.
Only a few months later the stock market rebounded and people, on average, became even wealthier. The reason, as previously noted, or better reasons are very simple: stock market gains and higher property prices across the board and globe. If you are in for a property at the moment, you are aware of the conundrum of high prices and fantastic opportunities.
In case you are wondering who cashed in the most: US citizens. Wealth in the US rose by 12.4 trillion dollars over the last year, whilst in Europe the increase was a quarter less: 9.2 trillion US dollars. But then again, wealth is very much concentrated. Apparently the wealthiest 10% of Americans own 98% of the US stock market. As a consequence the median wealth in the USA is not even in the top 20 globally. That’s, well, I guess makes you ponder. I let you decide how you feel about it. Thus, as most of us are probably not amongst the richest 10%, unless Elon Musk you are amongst my readers, then a big and heartfelt Welcome.
A couple of examples of added personal wealth
To show you the absurdity of a global pandemic and individual wealth, let’s return to the Credit Suisse wealth report. One of the main drivers was undoubtedly the extraordinary governmental economic stimuli in the form of financial subsidies and aid over the last 1 ½ years. By any measure the added wealth over the last year is flabbergasting. Take, for instance, Switzerland, the wealthiest country per adult. The average wealth per adult in Switzerland has gone up 70,730 USD from the previous year to 673,960 USD. Given Switzerland being a country with low taxes and many millionaires and billionaires who have taken up residence in the mountainous nation, the tremendous increase was not felt by everyone. This is the story for every country in our list. Let us thus look at the more meaningful median.
Thus, without any further ado, let’s jump right into it. Just as we did a few years ago , let’s again look at the median net wealth per person per country to get an accurate picture.
Average net wealth per person and per country
Rather than look at one year, let’s look at the wealth per adult in 2019 and 2020. A, hopefully, once-in-a-lifetime experience such as the pandemic calls for a more comprehensive view to better grasp the, in some cases, enormous developments on the individual wealth front.
| Country Median wealth per adult (USD) 2019 | Country Median wealth per adult (USD) 2020 | Homeownership % | |||
|---|---|---|---|---|---|
| Australia | 205,790 | Australia | 238,070 | 67 | |
| Austria | 83,010 | Austria | 91,830 | 55.3 | |
| Belgium | 195,220 | Belgium | 230,550 | 72 | |
| Canada | 114,360 | Canada | 125,690 | 69 | |
| China | 23,333 | China | 24,067 | 90 | |
| Denmark | 148,640 | Denmark | 165,620 | 60.8 | |
| Finland | 73,124 | Finland | 73,775 | 70.7 | |
| France | 126,470 | France | 133,560 | 64.1 | |
| Germany | 55,340 | Germany | 65,374 | 51.1 | |
| Greece | 55,158 | Greece | 57,595 | 74.6 | |
| Hong Kong | 184,320 | Hong Kong | 173,770 | 51.2 | |
| Ireland | 94,070 | Ireland | 99,030 | 68.7 | |
| Italy | 108,980 | Italy | 118,880 | 72 | |
| Japan | 115,350 | Japan | 122,980 | 61.2 | |
| Luxembourg | 255,645 | Luxembourg | 259,899 | 70.9 | |
| Netherlands | 119,230 | Netherlands | 136,110 | 69 | |
| New Zealand | 164,440 | New Zealand | 171,620 | 64.6 | |
| Norway | 115,930 | Norway | 117,800 | 80.3 | |
| Singapore | 80,060 | Singapore | 86,720 | 87.9 | |
| Spain | 97,870 | Spain | 105,830 | 76 | |
| Portugal | 59,553 | Portugal | 61,306 | 73.9 | |
| South Korea | 81,503 | South Korea | 89,671 | 58 | |
| Sweden | 74,080 | Sweden | 89,850 | 64.5 | |
| Switzerland | 132,640 | Switzerland | 146,730 | 41.6 | |
| Taiwan | 87,180 | Taiwan | 93,040 | 85 | |
| Thailand | 9,594 | Thailand | 8,036 | 80 | |
| United Kingdom | 123,420 | United Kingdom | 131,520 | 63 | |
| United States | 79,274 | United States | 79,274 | 65.3 | |
| Vietnam | 4,214 | Vietnam | 4,559 | 90 |
Data is based on the Credit Suisse Wealth Report and Databook, Statista
What Makes Some Richer Than Others?
Just as in the previous two articles (Wealth per person 2016 and Wealth per person 2015) on average net wealth per adult, homeownership is one of the keys to unlock great wealth.
For instance, countries with the highest median net wealth (with the exception of Switzerland) – Australia, Belgium, and Luxembourg – report homeownership rates of 67%, 72%, and 71%, respectively.
Of course, there are a number of exceptions, and it underlines that property in itself does not explain high individual net wealth, but it contributes. When looking at China, Thailand, and Vietnam, given their currently very low median net wealth compared to their high home ownership rates, the figures are somewhat misleading. All of these nations have been booming for quite some time and are in the process of becoming big power houses, or such as China, are already. Their net wealth is thus not in line with the home ownership rates. However, for most other countries on our list, this is certainly the case.
Other reasons are taxation, as can be seen in the example of Hong Kong with some of the highest individual net wealth of all countries. It allows for a very effective reinvestment strategy of dividends, income, and other returns from financial assets. It also leaves the individual with most of his or her income at their own free disposition.
In general, those with higher net wealth are frequently more invested in financial assets such as the stock market, property, or some other form of investment rather than keeping their money purely in savings.
Determine Your Own Wealth
If you want to determine your own net wealth, the calculation is simply subtracting all your liabilities from all your assets. For instance:
Assets (e.g., House value + Share value + Bonds + Savings) – Debt (e.g., outstanding mortgage)
- Log in to post comments